Operational example: This is an illustrative scenario, not a named customer engagement or a measured case study.
The Challenge
A mid-sized manufacturer invested in AutoCrib vending machines to manage consumables, reduce waste, and improve job costing. The system worked — usage was controlled, access was logged, and employees could quickly get what they needed.
But two years later, leadership asked a critical question:
"Are we actually saving money?"
The answer wasn't clear. AutoCrib generated usage logs, and the ERP system tracked purchasing — but the two systems didn't communicate. Each department had only a partial view of what was happening.
The problems included:
- AutoCrib tracked dispensing, but not full lifecycle cost
- ERP tracked purchasing, but not true consumption
- Finance couldn't reconcile spend vs usage
- Job costing was incomplete and required manual Excel work
- Department managers couldn't see their own usage patterns
- Replenishment was reactive, not data-driven
- ROI reporting was slow, manual, and often inaccurate
Although the company invested heavily in vending, they couldn't quantify the results — or improve them — without deeper visibility.
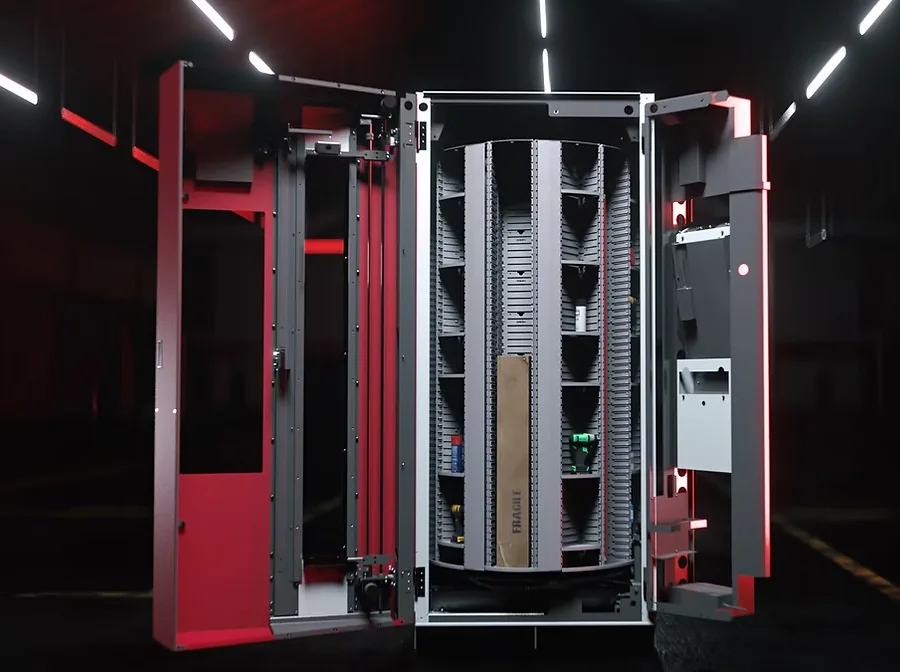
AutoCrib industrial vending machines inside a manufacturing facility
The Vysix Solution: Turning AutoCrib Into an ROI Engine
Vysix implemented a data foundation combining AutoCrib and ERP data that combined all vending- and purchasing-related data into one unified source of truth. This approach allowed the company to measure true consumption, cost trends, and ROI from their AutoCrib program.
1. Unified Data Warehouse
Vysix centralized all relevant data, including:
- AutoCrib vending machine logs
- ERP purchasing history
- Vendor cost and lead time data
- Job costing and work order usage
- Department-level consumption
- Stock levels and replenishment history
All data was standardized and merged into a single analytics-friendly structure.
2. Replenishment Reporting
Once normalized, usage patterns support:
- Suggested min/max levels
- Historical usage trends (illustrative, not predictive)
- Spike detection
- Low-stock alerts
- Overstock identification
- Cost-per-use insights
The result: fewer emergency purchases and smoother production flow.
3. ROI Dashboarding
With the data organized, Vysix built a dashboard showing:
- Cost trends by department
- Consumption changes over time
- Vendor pricing drift
- Waste reduction
- Pre-vending vs post-vending comparisons
- Tool life performance (cutting tools, PPE, consumables)
- Annualized savings
These dashboards created measurable, defensible results that proved the vending investment's value.
The Results
Within months, the manufacturer saw major improvements:
- Emergency purchases dropped sharply
- Departments gained visibility into actual consumption
- Purchasing decisions were finally data-driven
- Overstocking decreased
- Job costing accuracy improved
- Annual savings became measurable and repeatable
- Leadership gained confidence that the vending program was delivering real ROI
One of the biggest shifts: the company moved from reactive buying toward usage-informed planning.
Key Takeaways
- AutoCrib controls access; connecting its data to the ERP and Vysix BI adds visibility
- True vending ROI requires unified data from all systems
- Consumption-based forecasting reduces stockouts and waste
- Data visibility can improve job costing and departmental accountability
- A connected data foundation helps unlock more value from a vending program
Frequently Asked Questions
Can Vysix integrate with vending systems other than AutoCrib?
AutoCrib is the only vending connectivity Vysix has verified today. Other platforms would require integration discovery before a connection can be confirmed.
Does this require changes to the existing ERP?
No. Vysix connects to the ERP without disrupting existing workflows; AutoCrib/ERP is the connectivity path verified today.
Can Vysix help justify future vending purchases?
Usage and cost reporting through Vysix BI can help build the case, though results vary by facility and we don't promise a specific savings figure.